Most malware work does not fail on the hard question. It fails on the ten small handoffs around it. You pull a suspicious file into a disassembler, copy the strings into a notepad, spin up a throwaway VM to detonate it, paste the network indicators into a spreadsheet, check a CVE against a KEV list in a browser tab, and then try to write all of it up before you forget what you saw. Every tool is good. The seams between them are where the hours go, and where things slip. Pragma Binary is built to remove the seams: upload a binary, a .NET or Java assembly, or a script, and get the full picture in one workspace, from the disassembly all the way to an AI written report you can hand to someone else.
Part I. What Pragma Binary is
The whole job in one place
Pragma Binary is a malware analysis and threat intelligence platform. You give it a file and it takes that file apart from every angle that matters. It reads the code without running it. It runs the code in a place where running it is safe. It connects what it finds to a living picture of the threats you already track. And it writes the findings up for you. The pitch on the front page is deliberately plain: understand any file, detect every threat. The point of the platform is that all of that lives behind one login instead of behind six tools and a folder of scratch notes.
The file types are broad on purpose. Compiled binaries in PE, ELF, and Mach-O. Managed code in .NET and Java. Scripts in Python, JavaScript, PowerShell, C#, and Java. In practice that covers most of what actually lands in an inbox or on a host: the dropped executable, the obfuscated PowerShell in a phishing lure, the suspicious JAR, the packed loader. You do not have to know in advance what you are holding. You upload it and the platform figures out the right treatment.
The problem it removes
The problem is not that any single step is impossible. It is that the steps do not talk to each other. A disassembler does not know what a sandbox saw. A sandbox does not know whether the CVE you matched is on the KEV list. Your notes do not know any of it. So an analyst spends real skill on the investigation and then spends comparable time being a courier, moving data between windows and hoping nothing is lost in transit.
When the whole job lives in one workspace, that courier tax disappears. The strings the static engine pulled are the same strings the report cites. The network calls the sandbox recorded become indicators you can search and tag without retyping. The CVE you matched is already enriched with its exploitation probability and its KEV status. That continuity is the actual product. The individual capabilities are table stakes; keeping them in one context is the difference.
Who it is built for
| Who | What they get out of it |
|---|---|
| SOC and malware teams | Triage suspicious files fast, detonate the unclear ones, and share structured reports the team can act on right away |
| Threat intelligence analysts | Track actors, families, and campaigns, correlate samples into clusters, and keep indicators and CVEs current without the busywork |
| CTF players and researchers | Decompile and disassemble challenges faster, and ask the AI targeted questions about specific functions and logic |
| Red team and offensive security | Analyze implants and C2 frameworks, research vulnerability classes, and prototype ideas with AI guidance alongside |
New accounts start with 100 free Scan Credits and 50 free Research Credits, which is enough to run real files through the full pipeline before deciding anything. The first upload takes under a minute.
Why this matters beyond any one sample
The value compounds. A single file analyzed in isolation tells you about that file. The same file analyzed inside a platform that remembers every previous one tells you whether you have seen its family before, whether its imports match a cluster you already track, and whether its indicators overlap with an actor profile you built last month. One-off analysis answers "what is this." A connected platform answers "what is this, and where does it fit in the picture I am responsible for." The second question is the one that changes decisions.
Part II. Inside the platform
Here is the same tour, but following a file through the pipeline the way you would on a live sample.
Static analysis: take the file apart without running it
Start where it is safest to start, by reading. Static analysis lets you follow the logic and see exactly what a file is built to do without ever executing it.
Disassembly and decompilation are the foundation. You read the disassembly with syntax highlighting, jump between cross-references, and turn machine code back into readable pseudocode. It works across PE, ELF, and Mach-O, so the same view serves a Windows dropper and a Linux implant. For managed code the shortcut is even sharper: upload a .NET assembly or a Java JAR and get clean source back in seconds, ready to read, search, and analyze like any other project.
Control flow graphs turn a wall of instructions into something you can actually follow. Each function becomes an interactive flowchart that maps the branches, loops, and dead code, so you can trace how a routine runs without reading every line. The platform also renders interactive assembly graphs and a call stack graph, so you can move between the instruction level and the structural level without losing your place.
For scripts, the analysis is first class rather than an afterthought. Python, JavaScript, PowerShell, C#, and Java are parsed properly: functions, imports, and call relationships walked across multi file packages, not just a flat text dump.
Two things happen automatically while you read. Strings, imports, exports, and indicators get pulled out, with the suspicious ones surfaced so nothing hides in the noise. An AI analyst reviews the whole file and writes a detailed report covering what it does, how it behaves, the MITRE ATT&CK techniques it uses, and the indicators worth blocking. That report is the artifact you hand to the next person, and it was generated from the same context you were just looking at.
Dynamic analysis: watch it run somewhere safe
Some behavior only shows up at runtime. Packers unpack, droppers drop, and C2 beacons phone home only when the code actually executes. So the platform gives you a place to let that happen without risk.
You detonate a sample in an isolated virtual machine and watch what it does. The platform picks the right guest for the file, so a Windows binary never lands on a Linux host and the other way around. You can watch the detonation happen live from the browser, or come back to the screenshots and timeline once the run finishes.
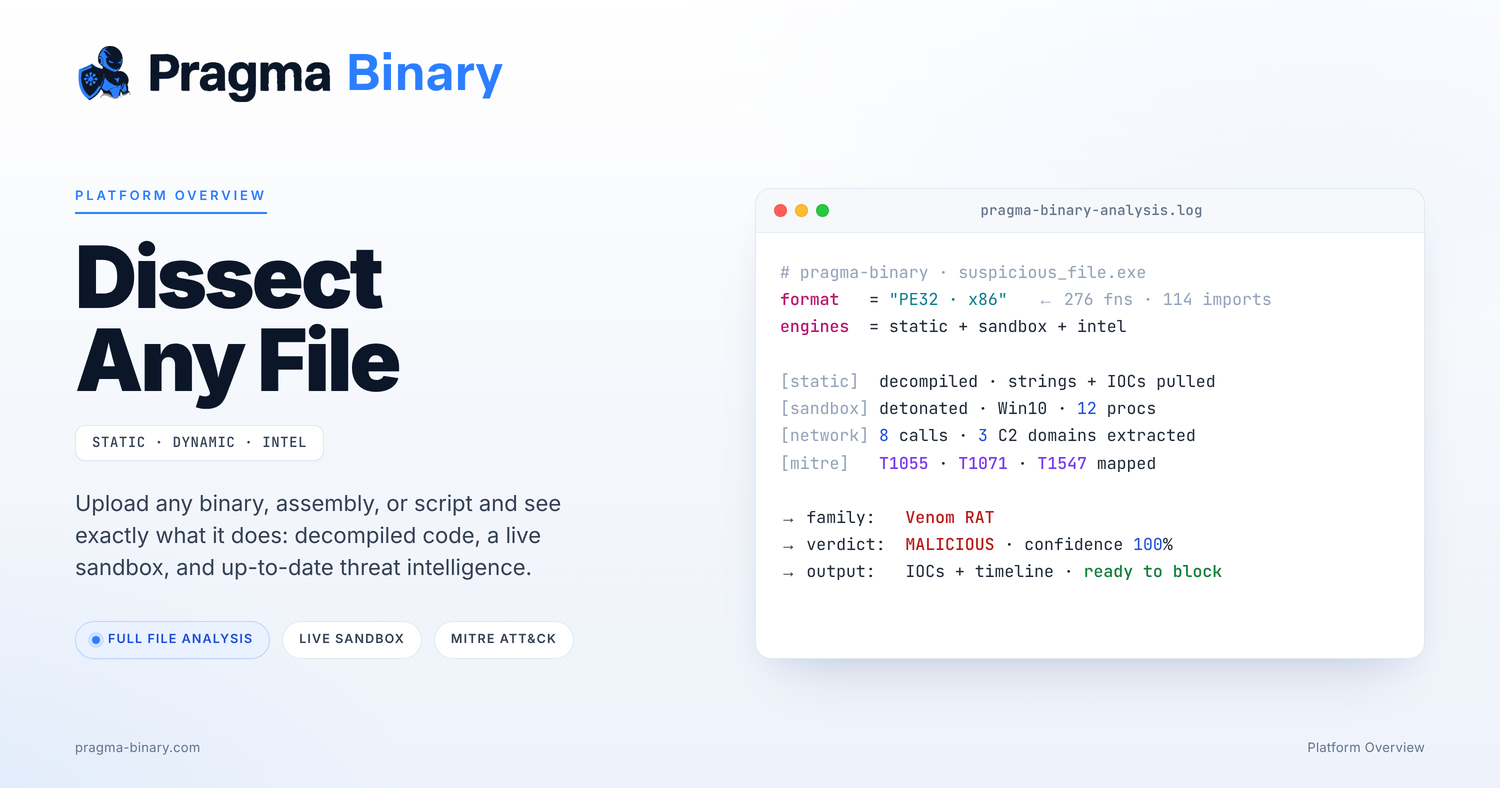
Every run is recorded in full: the process tree, file activity, network traffic, dropped files, and screenshots, all mapped to MITRE ATT&CK. The mapping matters because it turns raw events into meaning. "Process spawned, registry key written, outbound connection made" becomes a labeled technique you can reason about and report on. A short analysis session looks like this end to end:
Analyzing:  suspicious_file.exe
Format:     PE32   Functions: 276   Imports: 114
Sandbox:    detonated on Windows 10   12 processes, 8 network calls
Detected:   Venom RAT
Verdict:    MALICIOUS   Confidence: 100%
The static pass gave you the structure and the imports. The dynamic pass confirmed the behavior and the verdict. Neither had to be stitched together by hand.
Threat intelligence: turn samples into a picture
Every file you analyze feeds a living picture of the threats you face, connected both to open source intelligence and to your own history.
Indicators stay fresh from open sources like ThreatFox and URLhaus, and every detonation adds your own to the pool. You can search them, tag them, and group them into collections. Vulnerability tracking follows CVEs with their CVSS scores, EPSS exploitation probability, affected products, and patch links, and entries in the CISA Known Exploited Vulnerabilities catalog are flagged and enriched automatically, so the vulnerabilities that are actually being exploited stand out from the ones that are merely scored high.
An asset watchlist inverts the usual scanning model. You list the products you run, and the platform tells you which known vulnerabilities affect them, with no network scanner required. Threat profiles let you build records for the actors, malware families, and campaigns you track, then link the samples and indicators that belong to each. Investigation graphs connect related samples through shared families, import hashes, and YARA matches, so you can explore an entire cluster visually on one canvas instead of guessing at relationships in a spreadsheet. And URL scanning gives links the same treatment as files: submit a URL and get its verdict, indicators, and related intelligence back.
Hunt, monitor, and automate: stay ahead and connect it to your stack
The last layer is about not having to be watching. YARA hunting lets you write or generate rules, run retro hunts across your whole corpus, and start from a large open source rule set on day one. Alerts and monitoring let you set rules that watch for a malware family, a verdict, or a YARA match, and get an alert or an email the moment something matches.
Everything you can do in the interface is available over a token authenticated public REST API, with per key quotas and rate limits built in, so the platform slots into pipelines and existing tooling rather than becoming another island. Team workspaces add shared, role based access control, so every member sees exactly what they should and nothing they should not.
The shape of a real investigation
Put the layers together and a typical investigation reads as one continuous flow rather than a relay race. A file arrives. You upload it. Static analysis gives you the decompiled logic, the control flow, the strings, the imports, and a first AI report. The unclear parts go to the sandbox, which returns a behavior timeline mapped to ATT&CK and a verdict. The indicators from both passes land in your intelligence store, matched against KEV tracked CVEs and correlated into an investigation graph with samples you have seen before. A YARA rule generated from what you learned goes into a retro hunt and a monitoring alert, so the next member of the family announces itself. The write up was being assembled the whole time. That is the difference between owning ten tools and owning one platform.
What changes when the whole job lives in one place
A few things generalize beyond any single feature, and they are the reason to consolidate rather than assemble.
- Context stops leaking between steps. The strings the static engine found, the calls the sandbox saw, and the CVE you matched all share one workspace, so nothing has to be retyped and nothing gets lost in a handoff.
- Meaning is attached at the source. Behavior is mapped to MITRE ATT&CK as it is recorded, and vulnerabilities carry EPSS and KEV status on arrival, so events show up already interpreted instead of as raw data you have to decode later.
- History makes each new sample smarter. Because every analysis feeds the same intelligence store, a fresh file is automatically checked against the families, hashes, and indicators you have already collected, and correlation is a side effect rather than a project.
- The report is a byproduct, not a second job. The AI written report is generated from the same context you investigated in, so documentation stops being the tax you pay at the end of every case.
- Automation closes the loop. YARA retro hunts, alerts, and a full REST API turn a one time finding into ongoing coverage and let the platform live inside the stack you already run.
Closing thoughts
Pragma Binary is not, at bottom, a better disassembler or a nicer sandbox, though it is both. It is the decision to treat file analysis as one job instead of a dozen loosely connected ones. The hard part of malware work was never the individual capability. It was carrying context across the gaps, and losing a little of it every time. Close the gaps and the same analyst gets faster, the same finding travels further, and the same file teaches you more because the platform remembers every file that came before it.
If that is the direction you want your own workflow to move, you can start with a free account and 100 Scan Credits, upload your first file in under a minute at pragma-binary.com, or book a walkthrough with the team.